Continuing with the ongoing discussion of heightened Inflation and Interest Rates among Western countries, something needs to be said about the UK. The British Office of National Statistics (ONS) has released its official records on the UK economy for April 2022. Based on their data, the UK is experiencing the highest Inflation Rate out of all the other leading Western economies, its official Consumer Price Index (CPI) from last month having reached 9%. It should be seen as a huge uptick in the British CPI, which was somewhere around 5% at the beginning of this year. For comparison purposes, I am including two line graphs depicting the CPI for January 2022 and April 2022. Both graphs show the CPI ascending rapidly since the start of the Pandemic.

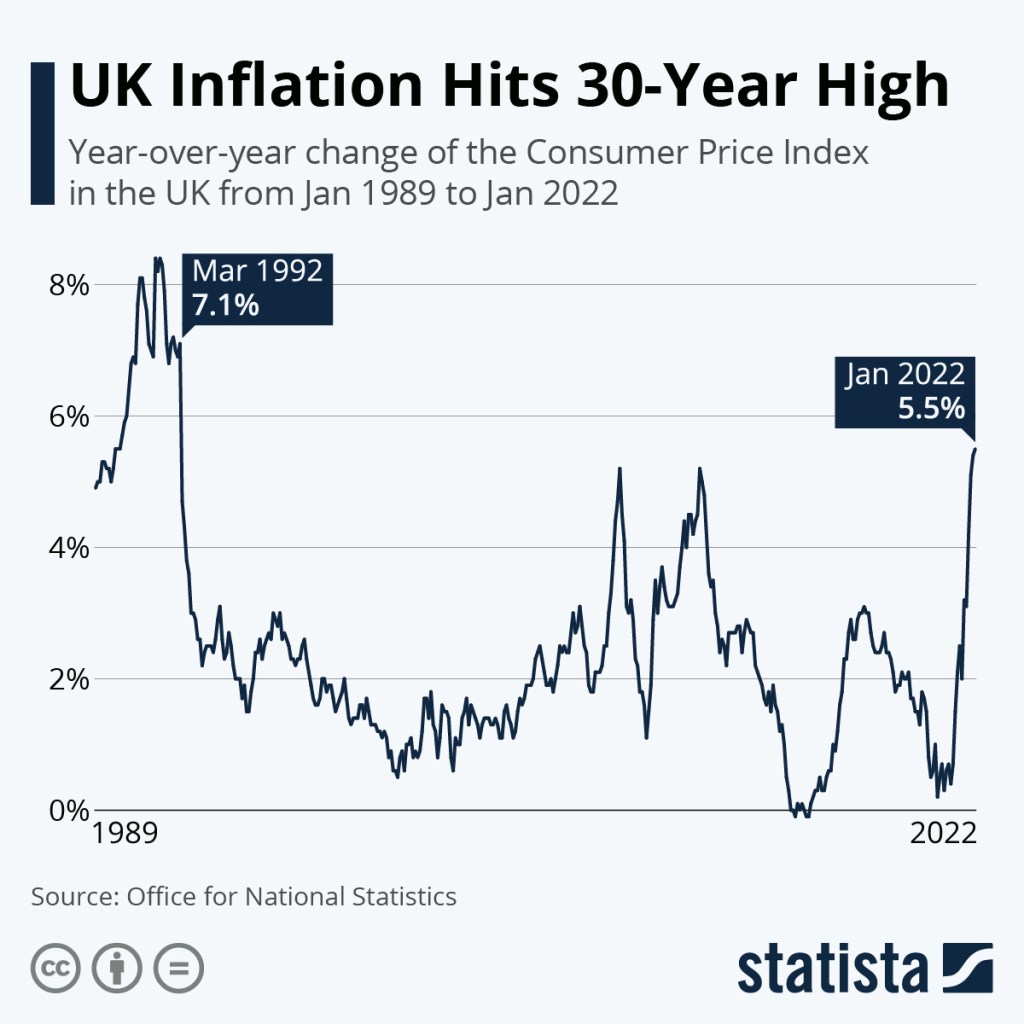
Note the major jump in Inflation prior to the Pandemic. That came as a result of the Brexit Referendum and the attempts by the British to leave the European Union. While it may be beyond the immediate purview of this entry, it is interesting nonetheless to infer that Brexit had some role to play in the pre-Pandemic Inflation Rate for the UK.
Additionally, energy prices have made significant increases within the same timeframe. These energy prices are related to the realm of housing and household services. In fact, the highest contributor to the UK’s Inflation Rate came from that particular area of the national economy. What was causing those prices to rise is attributed to the concurrent increases in the prices for electricity and fuel:
“Housing and household services contributed 2.76 percentage points to the CPIH 12-month inflation rate in April 2022, of which 1.86 percentage points came from electricity, gas and other fuels. This was the largest contribution from any division this month, and the largest contribution from housing and household services since the start of the National Statistics series [note 1]. The contribution rose significantly in April 2022 as a result of price rises for gas and electricity. This follows the increase in the Office of Gas and Electricity Markets (Ofgem) cap on energy prices, which changed on 1 April 2022. This followed an earlier rise in the price cap on 1 October 2021, which led to a 1.23 percentage point contribution from housing and household services.
The Ofgem energy price caps limit the price energy suppliers can charge the estimated 15 million households that either use a prepayment meter or are on the ‘standard variable’ energy (or default) tariff. They update the energy price caps twice a year, in April and October, and on 3 February, Ofgem announced the cap levels for the period from 1 April to 30 September 2022. They said that ‘Those on default tariffs paying by direct debit will see an increase of £693 from £1,277 to £1,971 per year (difference due to rounding). Prepayment customers will see an increase of £708 from £1,309 to £2,017. The increase is driven by a record rise in global gas prices over the last six months, with wholesale prices quadrupling in the last year.’ The rise resulted in 12-month inflation rates of 53.5% for electricity and 95.5% for gas, compared with rates of 19.2% and 28.3% respectively in the previous month.
Elsewhere within housing and household services, owner occupiers’ housing costs (OOH) rose by 2.9% in the year to April 2022. This was the largest 12-month rate in the National Statistics series, which begins in January 2006, and the largest since April 1999 in the earlier historical constructed series, when it was 3.2%. This resulted in a contribution of 0.53 percentage points to the CPIH annual inflation rate.”
Later in that same report, the ONS mentions that, outside of the aforementioned housing and household services, the other two contributing factors were in hospitality and restaurant sectors. The following are excerpts from the two sections pertaining to those areas of the British economy:
“There was also a large upward contribution to change (of 0.11 percentage points) from restaurants and hotels. Overall, prices rose by 1.7% between March and April 2022, compared with 0.7% a year earlier. The upward effect came largely from restaurants, cafes and dancing establishments, where all items in the basket increased in price. This is consistent with the increase in Value Added Tax (VAT) from 12.5% to 20% on 1 April 2022. VAT was lowered to 5% for the hospitality sector alongside the August 2020 Eat Out to Help Out Scheme, and remained at 5% until 1 October 2021, when it was increased to 12.5%. The most recent change returns VAT for the hospitality sector to the rate that was in place before the coronavirus (COVID-19) pandemic. By comparison, between April 2020 and April 2022, restaurant and café prices have grown by 8.4%.”
“A further large upward contribution to the change in the CPIH 12-month inflation rate came from recreation and culture, increasing the rate by 0.10 percentage points between March and April 2022. Games, toys and hobbies contributed 0.14 percentage points to the change in the rate where overall prices fell by 1.0% between March and April 2022. This is compared with a larger fall of 7.2% between the same two months a year earlier. The movements largely reflect price changes for computer games, which can sometimes be large, in part depending on the composition of bestseller charts. Therefore, short-term movements need to be interpreted with caution. There was a partially offsetting downward contribution to change from recording media of 0.03 percentage points. Here prices fell this year but rose a year ago. Again, price movements for recording media items can be influenced by the contents of bestseller charts.”
Is it odd how the UK’s Inflation Rate seems higher than other Western countries, including that of the US? Would the ongoing trend in rising prices for petroleum products be the key factor in these increases? I am inclined to believe that it is possible insofar as the UK is an island nation that has to import much of its petroleum products from elsewhere. As the following chart shows, much of the petroleum and natural gas imported by the UK is coming from Norway:

The fact that the UK is importing a significant portion of its petroleum products is an important detail which is not given enough attention in the local British press. A petroleum industry study earlier this year reported that British consumption of petroleum products has outpaced domestic production for the first time. The study concluded that unless the British begin expanding its infrastructural capabilities for extracting crude oil from the North Sea, there will simply be not enough petroleum to sustain the current rates of consumption, resulting in higher prices and thus higher Inflation:
“The 2022 Business Outlook report – the first published under the trade body’s new guise – claims that although there are enough hydrocarbon reserves to support the UK for at least 15 years, there has been a lack of investment in the platforms, pipelines and other infrastructure needed to access it.
Meanwhile offshore wind, a major source of renewable energy, is still too small as it stands to offset the declines in North Sea output, the study claims.
OEUK’s market intelligence manager Ross Dornan said: ‘About 75% of the UK’s total energy comes from oil and gas – about 2% up on last year. That is because 80% of our homes are heated by gas which is also used to make 42% of our electricity. We also have 32 million vehicles that rely on petrol and diesel.’
‘The energy gap between what we produce ourselves and that which comes from other nations will keep growing unless we invest in exploration and production on the UK’s continental shelf. We must also accelerate the development of cleaner energy like hydrogen. Investment now will give us energy security in the years to come.’
‘Additionally, the emissions generated by processing and transporting our own oil and gas are much lower than for imports.’”
It can also be inferred from the two preceding graphs that the UK’s Inflation Rate was the result of several factors external to its national economy. Earlier this month, back on May 5, the Bank of England released an official statement concerning the effects of Currency Depreciation on the Pound Sterling. There are two relevant passages which I feel is worthy of mention:
“There is more than one reason why the rate of inflation is so high now.
It started to rise in 2021 and that was partly to do with the economy recovering from the Covid crisis.
Economies around the world, including in the UK, opened up after Covid restrictions eased. And then people naturally wanted to start buying things again.
But businesses selling some of those things couldn’t get enough of them to their customers. This caused prices to rise – especially for goods coming from abroad.
Added to that, there was a very sharp rise in energy (oil and gas) prices. All of these things pushed prices (and the rate of inflation) up.”
“In early 2022, Russia’s invasion of Ukraine led to more large increases in the price of things like energy and food.
The lockdowns in China (due to Covid) are also making it harder to import some goods to the UK. So that is pushing up prices too. These two factors explain the large majority of the increase in inflation.
At home, unemployment is low and the labour market strong, which has led to an increase in wages – a major element of the costs of service-sector businesses. So we’ve started to see the price of services in the UK go up too.
These are all reasons why we expect inflation to keep rising. It is hard to predict the future, but we think it’s likely to reach around 10% this year and go down next year. We expect it to be close to 2% in around two years.”
Consistent with the Bank of England’s statements is the piecemeal rise in the British Interest Rate. The Interest Rate back in December 2021 was 0.25%. It gradually rose to 0.50% in February, then 0.75% by the following month. As of this month, the Interest Rate stands at 1.00%. Given the Bank of England’s past actions over the last several months, the possibility is there for the Interest Rate to increase in small increments across a long-term period. Below is a line graph depicting the current extent of Interest Rate increases. The Interest Rate, prior to the Pandemic, had been steadily dropping from 1992 to 2009. It coincides with the 1992 Recession of Black Wednesday and the 2008 Great Recession:

The key lesson to be taken from this entry of Economic History Case Studies is that the high standards of living touted by Liberal Capitalist regimes can only be made possible by sources of cheap petroleum products. Even though there are official declarations and attempts here and there to shift away from petroleum, these effects in the West are hardly enough to make any lasting change to this conclusion of mine. The Socialist Nation that is able to create its own alternative fuel sources without having to be dependent on imports and especially exports of petroleum will become more self-sufficient and resilient against the effects of Currency Depreciation. As the experiences of the Soviet Union and the Eastern Bloc countries have shown, there is almost nothing to gain from being an exporter of petroleum products. This lesson is further buttressed by the fact that post-Soviet Russia is still dependent on exporting petroleum to other nations, in addition to the British and Norwegians striking a decision to curtail Russian petroleum imports.
Categories: Economic History

Leave a comment