One of the proposed additions to the Second Edition of The Work-Standard pertains to the inclusion of special Charts that demonstrate the Work-Standard’s Pricing Model. The Intent is to provide conceptual tools to the would-be economic planner concerning the relationship between the Quality of Products being manufactured and the Frequency for those Products in a Cooperative or a State-Owned Enterprise within the Planned/Command Economy. Everything described here has already been described in the First Edition. What is new, however, are the Graphs and Flow Charts to go with them to provide further comprehension.
We begin with a Graph such as the following:
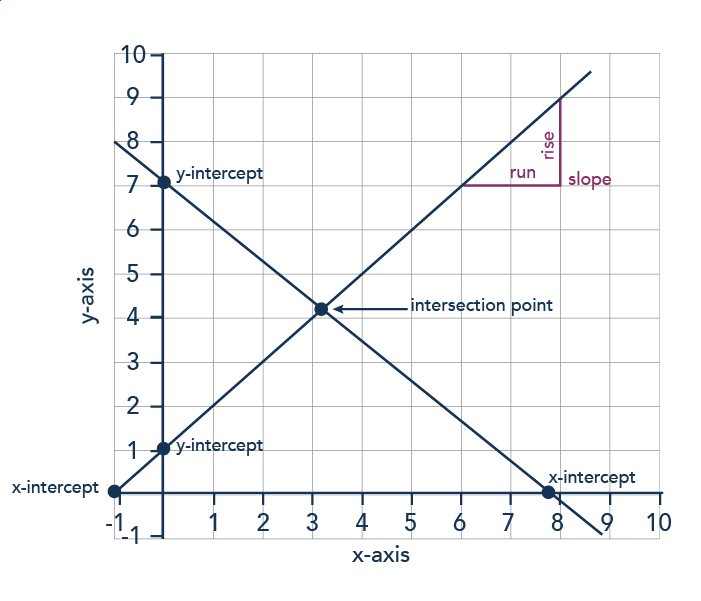
The X-Axis is the Unity of Effort. It affects the rate at which the Product is being created based on its prearranged Price, a very important observation distinguishing The Work-Standard’s Price Model from the Liberal Capitalist version. Higher values on the X-Axis indicates how many are being manufacturing across a given timeframe. Unlike the Liberal Capitalist version of this Chart, the Pricing is done independently and beyond its immediate purview.
The Y-Axis is the Unity of Command. It affects the rate at which the Product is being counted toward the Quality of Arbeit (QW), another important observation distinguishing The Work-Standard’s Price Model from the Liberal Capitalist version. Higher values on the Y-Axis indicates the current QW value for every Product manufactured. And unlike the Liberal Capitalist version of this Chart, the QW value also affects the Quality of Geld (QM), should the Arbeit be converted into Geld by the Central Bank.
The Downward Slope is the Quality of the Product (shortened to “QP”), whereas the Upward Slope is the Frequency for the Product (shortened to “FP”). Higher FP values are correlated by lower QP values because that means more people are purchasing the same Product in larger amounts at a given Price, forcing the manufacturer to either engage in cost-cutting measures (to maintain the same rate of production) or just raise the Price of the Product. Conversely, lower FP values are correlated by higher QP values because fewer people are purchasing the same Product, allowing the manufacturer to maintain the same rate of productivity at the prearranged Price. Let the shortages of the Coronavirus Pandemic serve as an inconvenient reminder as to why this is important.
Finally, the Intersection Point denotes the Synchronicity between the QP and FP values, the Unity of Effort and the Unity of Command. It helps determine the Sustainability or the Unsustainability of the overall production process under the Intents of Command and Obedience. This becomes increasingly apparent when one evaluates the emerging differences between QP and FP in relation to the Attrition/Inaction Rate. Overproduction leads to unwanted increases to the Attrition Rate, whereas Overconsumption leads to unwanted increases to the Inaction Rate. Beware of any signs of corruption, waste, fraud, and abuse.
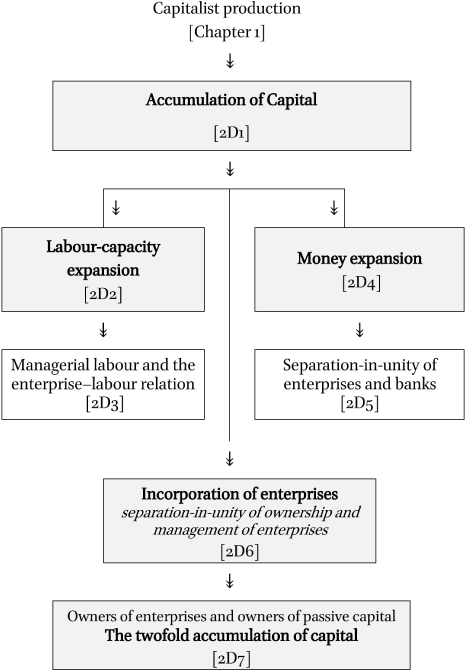
All of these features should be distinguishable from the Liberal Capitalist version insofar as the Liberal Capitalists themselves are trying to find a relationship between Quantity of Products in Existence and the Quantity of Kapital in Unit-Price. Under the Incentives of Supply and Demand, the Inflation/Deflation Rate is affected by the Quantity of Kapital already in circulation in the Market/Mixed Economy by the Fractional-Reserve Banking System. The only independent variable which the Liberal Capitalists cannot control is the Quantity of Schuld, which is somewhat mitigated by relying on the Financial Markets for ready sources of Kapital.
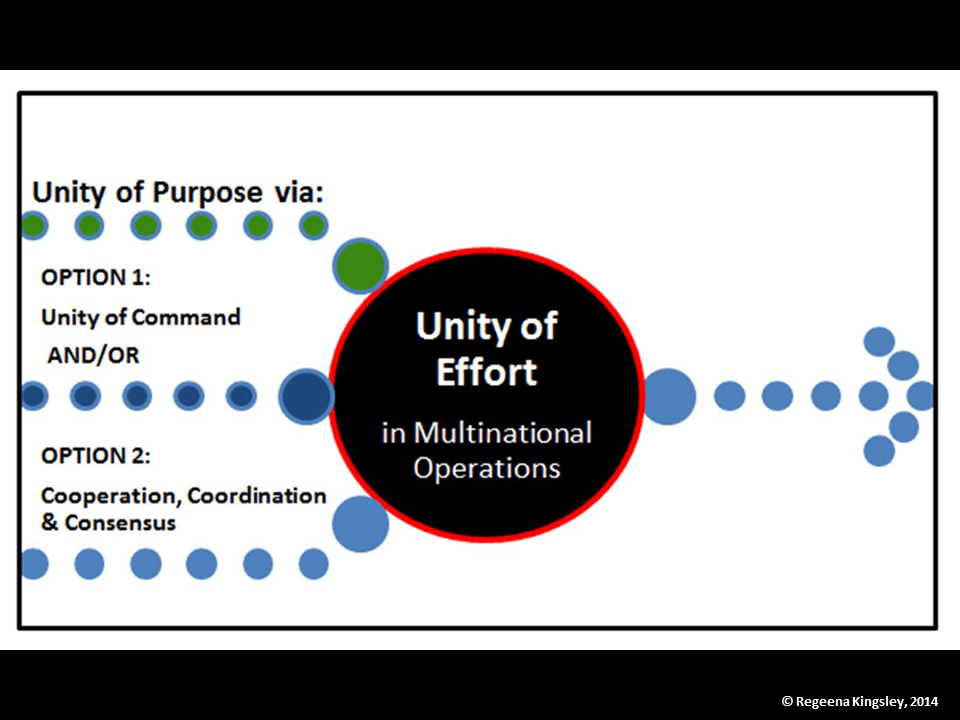
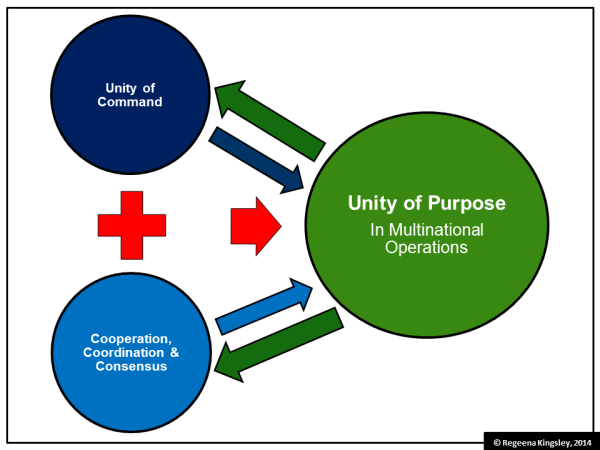
Below is an examples of the Liberal Capitalist equivalent and two Flow Charts to show how this Graph resembles in practice:


Categories: Blog Post

Leave a comment